Voice of the Danube
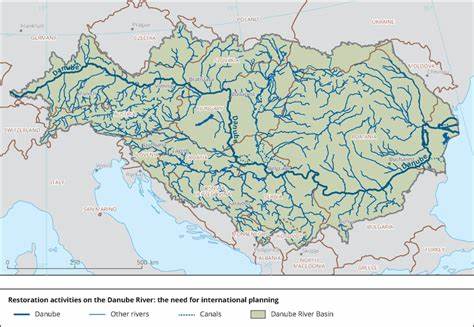
The Danube is Europe’s largest river, crossing eight Central and Eastern European countries and with a catchment area of 801,463 km² (Figure 1). The river is of significant economic importance, not the least as a major transportation route. Actually, the Danube’s role as a main European trading route dates back to prehistoric times.
Ships can navigate the Danube for 87% of the river's total length, all in all 2,411 kilometers downstream to the Delta. Ships call 78 harbours located along the Danube between Kelheim in Germany and the Black Sea in Romania. Therefore, the capacity of the Danube waterway is a key factor for Europe's inland navigation network. It is determined mainly by prevailing nautical conditions (i.e. the navigability of the Danube with a cost-effective vessel draught loaded over the course of the year). This has a direct influence on the potential capacity utilisation of vessels navigating the river[1].
Good nautical conditions and continuous maintenance of the waterway’s infrastructure enable the sector to offer reliable and competitive transport services to ensure the sustainable integration of inland navigation as an environmentally friendly mode of transport within the logistical concepts of a modern economy. Cargo transport on the entire navigable Danube between Kelheim (Germany) and the Black Sea via the Danube-Black Sea Canal and the Sulina Canal ranges between 34 and 40 million tons per year[2] (Figure 3).

(Sources: for transport volumes – viadonau, Annual reports on Danube navigation; for transport performance – Eurostat [IWW_GO_ATYGO]
It is therefore of crucial importance to monitor the nautical conditions and maintain the fairway in a consistent manner to secure its passability at all times. This involves the timely planning and executing of dredging or path tracing activities.
The responsible agencies for the Exploration and Maintenance of the Danube River observe and analyze the nautical conditions in their segments of the waterway as part of their daily routine. In this, they rely on measurements of the hydrological status of the river, e.g. water level, discharge, etc. and the hydrodynamical status, e.g. depth, riverbed, etc., of critical areas where the fairway passability could become compromised.
A range of observations and analytics have to be performed to provide quality daily information, including the daily publishing of fairway navigational purposes. Which is where advanced forecasting instruments come into play.
Hristo Enchev, Chief Director of "Hydrology and hydrometeorology" Directorate at EAEMDR, summarizes why these can make a difference:
"In the so-called critical sections of the river, intensive morphological changes are observed and the trajectory of the shipping route often changes. Forecasting sediment movement would help:
- For timely moving of the marking signs according to the greatest depths.
- To assess the need for future dredging activities.
- To assess the needs for trawling and cleaning the waterway.
- To design engineering facilities.
- To select a location for seizing alluvial deposits from the Danube River for commercial purposes.
- For all permits related to the use of a water body, predicting the location of anchorages, winter shelters, etc."
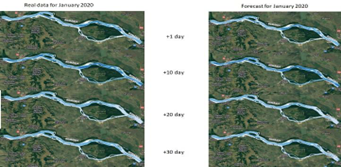
Luckily, a forecasting solution ready is already at hand: Mozaika has developed a method to forecast and visualize the fairway on the map, based on forecasting changes in the hydrodynamic conditions of the river as part of its water resources management platform ISME-HYDRO[3].
As Figure 4 shows, the forecasts produce results for depth that are undistinguishable from real measurements with bare eye.
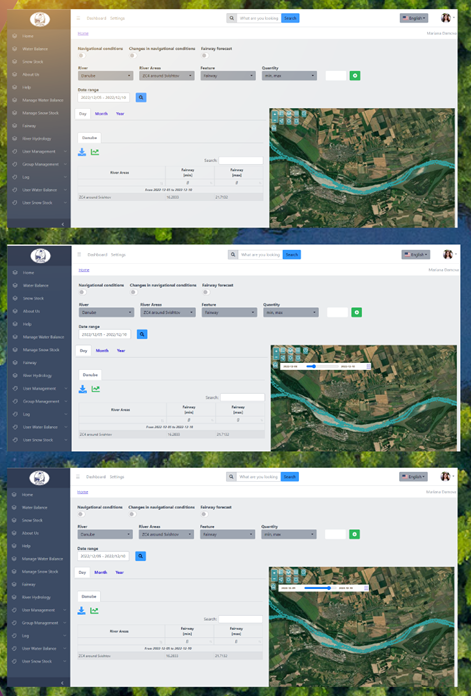
The fairway forecast is visualized on an interactive map (Figure 5, showing fairway forecast for three consecutive days), and it can be compared with real fairway, past fairway trajectories can be reviewed, and from there trends in the evolution of the river can be pulled out, the impact of the climate change can be stated, and more importantly efficient planning for the operations of the river and securing the safe fairway can be ensured. The tool will be put into operational use at the EAEMDR, and can be adopted by other Danube Agencies.
References:
[1] Danube navigation at a glance: https://ines-danube.info/ilias.php?baseClass=ilrepositorygui&cmd=sendfile&ref_id=1442
[2] https://inland-navigation-market.org/chapitre/2-freight-transport-on-inland-waterways-3/?lang=en